
Application note ·
Proving porosity, core-shift and wall-thickness control as foundries move to printed sand cores
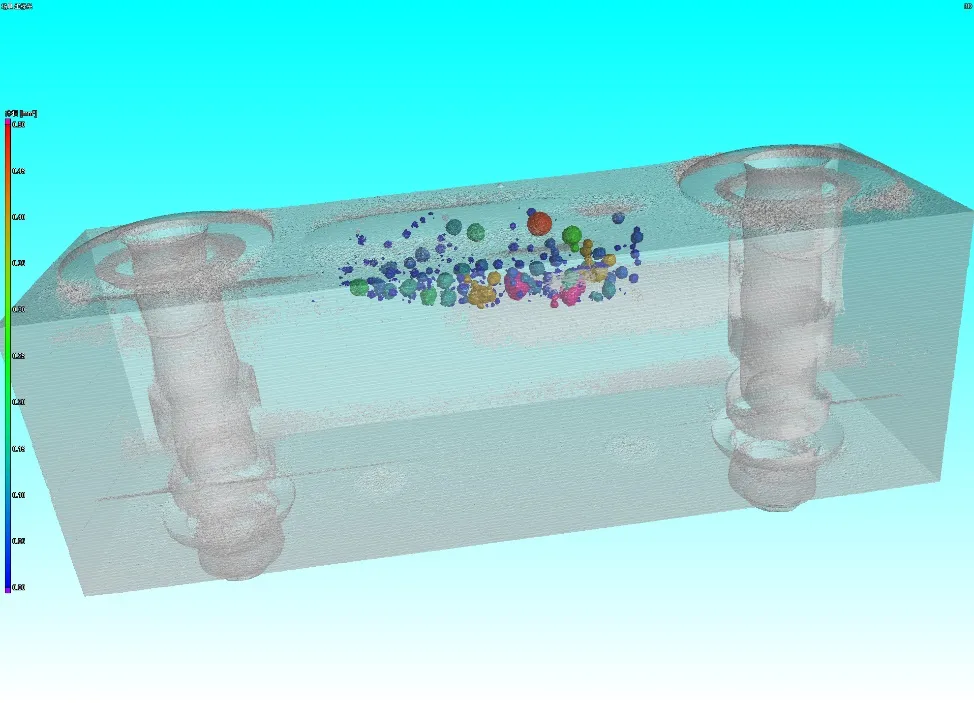
Royma Laboratory CT gives foundries a measured answer on porosity, core position and wall thickness when they switch to 3D-printed sand cores. A custom inspection cell with a 225 kV X-ray source, a rotating platform and 780 mm of stage travel scans large aluminium castings in 3D. Our analysis software then reports porosity as an area and volume fraction, with every pore mapped.
This application note is for foundry process and quality engineers evaluating printed cores. It shows what a computed tomography (CT) scan measures on the first castings and how the result supports release of the new process.
CT proves what a printed core changes inside the casting
Printed sand cores allow core geometries that conventional core shooting cannot produce. Foundries across Europe are adopting them to cast thinner walls and more integrated aluminium parts. The gain only counts once it is shown on the part: the same or lower porosity, the core where the drawing puts it, and every wall within tolerance.
All three lie inside the casting. A 2D radiograph shows porosity as a shadow, but it cannot say at which depth a pore sits. It also cannot measure a wall hidden behind another wall. Sectioning measures one plane and destroys the part. A CT scan keeps the casting intact and delivers a 3D volume you can slice at any position.
Three questions recur when a new core process is qualified:
- Porosity: is the gas and shrinkage porosity in critical zones the same or better than with the previous cores?
- Core position: did the core stay where it was placed, or did it shift or float during pouring?
- Wall thickness: do the thin walls the new cores make possible reach their nominal thickness everywhere?
Automatic porosity analysis replaces the visual read
Royma’s porosity analysis works directly on the CT volume. It calculates the area porosity rate on each slice and the volume void rate for the whole part or a chosen region. Detected pores appear in colour-coded maps on 2D slices and 3D renderings.
For each pore the software reports its diameter and its position in the part. The AI-based evaluation also gives a statistical probability for each detection. The result is a documented figure rather than an operator’s judgement of a grey-scale image. You can compare trials with printed cores against castings from your existing process on the same basis.
“A foundry moving to printed cores needs evidence, not an impression,” says Jens Lübbehüsen, Sales Director Europe at Royma Europe. “The CT scan gives a porosity figure for each casting and shows where every pore sits, so the old and new processes can be compared part by part.”
One scan also checks core position and wall thickness
The same scan that shows the pores contains the complete geometry of the casting. Internal channels and cavities formed by the core appear as clearly as the outer surfaces. Compared with the CAD model, the volume shows whether the core produced its cavity in the intended position. It also shows whether a thin wall is thinner on one side, the typical sign of core shift.
Because the data is 3D, wall thickness is checked across the whole casting, not at a few cut positions. One scan answers all three questions on one part, and the part remains available for further tests.
A cell sized to the casting, not to a cabinet
Large structural castings and gearbox or transmission housings often exceed the part size of a standard CT cabinet. For such parts Royma builds an offline inspection cell engineered to the part. It combines a 225 kV X-ray source and detector module with an XZ-axis module and a rotating platform, which enables full CT reconstruction, not only 2D radiography.
The stage travels up to 780 mm on the X-axis and 450 mm on the Z-axis. The lead-shielded enclosure measures approximately 2500 × 2500 × 1800 mm. A POM plastic carrier holds the casting on the stage.
| Stated figure | Royma Laboratory CT inspection cell for castings |
|---|---|
| Installation | Offline, engineered to the customer’s parts |
| X-ray source | 225 kV source-detector module |
| Motion | XZ-axis module and rotating platform for CT reconstruction |
| Stage travel | X-axis up to 780 mm; Z-axis up to 450 mm |
| Shielded enclosure | Approx. 2500 × 2500 × 1800 mm |
| Porosity analysis | Area porosity rate and volume void rate; colour-coded 2D and 3D maps |
| Per-pore data | Diameter, position and detection probability |
Practical notes for qualifying a new core process
Scan castings from the existing process and from printed-core trials, cast from the same alloy and pattern. The comparison is then made on the same criteria and at the same resolution. Define the critical zones and the pore-size classes of your acceptance specification before the trial series, so that the measured pore sizes are read against them from the first scan.
The detail CT resolves depends on part size, wall thickness and alloy. A small region scanned close to the source shows finer pores than a full housing scanned in one piece. We therefore recommend a test scan of your own castings before sampling plans and acceptance limits are fixed. More casting inspection tasks are described on the casting applications page.
Royma Europe offers test scans of castings from printed-core trials and support in defining a CT inspection cell for your parts. Contact Jens Lübbehüsen, Sales Director Europe, Royma Europe, j.luebbehuesen@roymatek.eu, +49 1709782937 – www.roymatek.eu.
Royma Europe, Leibniz Universität Hannover – Institut für Produktentwicklung und Gerätebau, Gebäude 8143, An d. Universität 1, 30823 Garbsen, Germany.