Application note ·
Forecasting the ROI of 100% inline cell CT: how to measure your own false-reject and escape rates before you buy
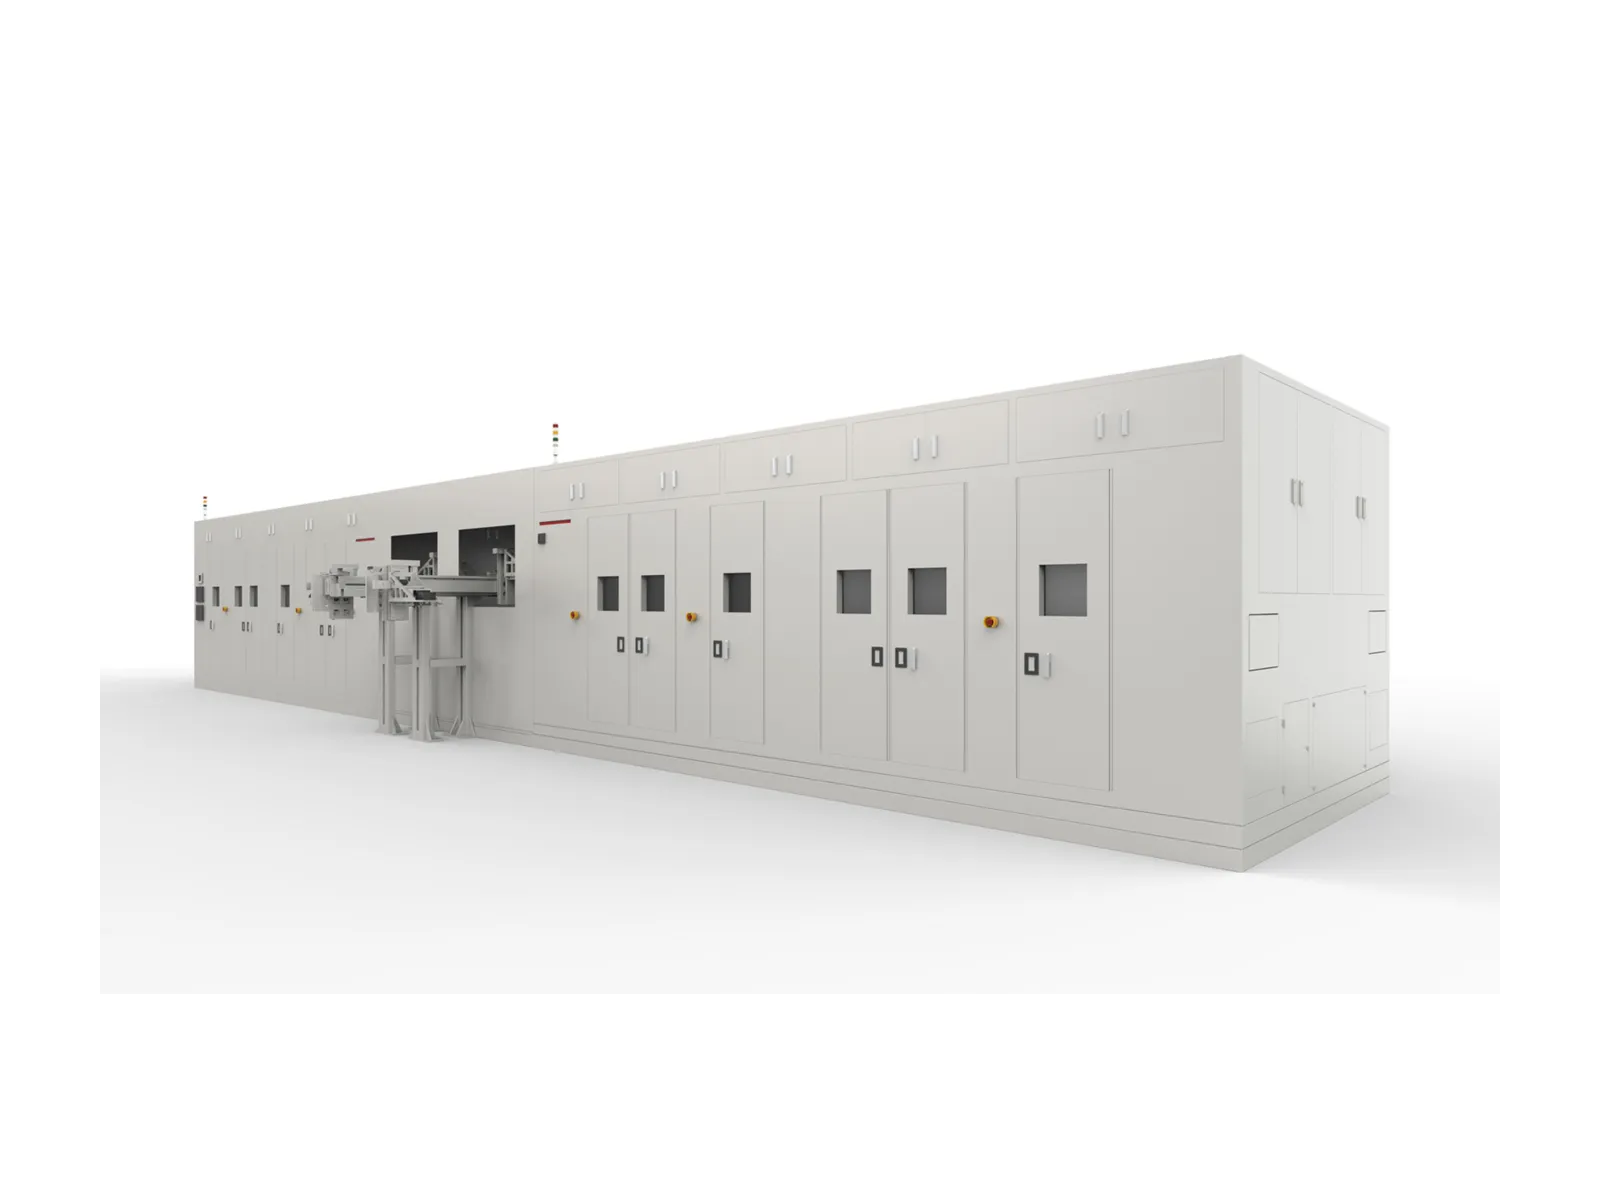
Royma’s RMLCT7500 inline gantry CT inspects every prismatic cell in 3D at line speed, and Royma Europe helps cell plants forecast its return on investment from their own false-reject and escape rates, measured on their own cells before any purchase decision.
The RMLCT7500 reaches up to 36 ppm, depending on gantry configuration, cell thickness and the number of inspection points. Speed alone, however, does not decide whether an inline CT pays back. Two error rates of the inspection a plant already runs decide it, and both can be measured on real cells from the line.
Two error rates decide the payback
Every inline stack inspection makes two kinds of error. A false reject removes a good cell from the line and scraps the material and process cost already in it. An escape lets a faulty cell pass, so it consumes formation and every later process step, or reaches the customer.
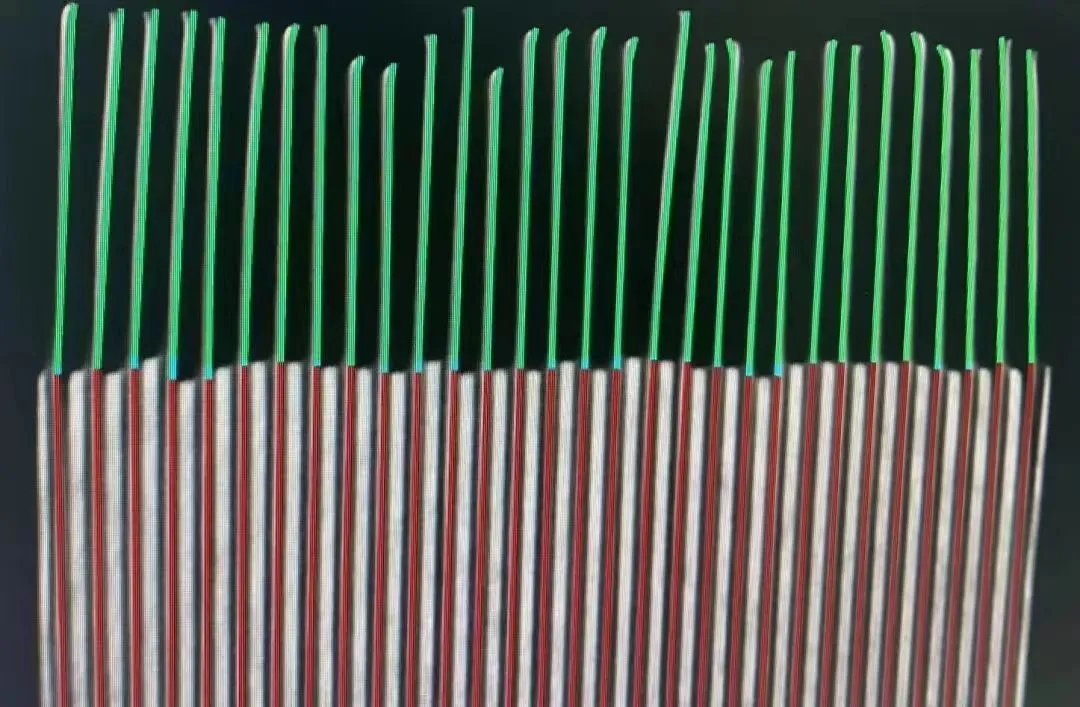
In a 2D X-ray image of a stacked cell, the electrode layers overlap. Judging overhang at the four corners from that shadow image leads to misjudgement in both directions. Laboratory CT resolves each layer clearly, but it is too slow for 100% inspection. Inline 3D CT is built to combine both: every layer visible, every cell inspected, at the line’s takt.
Your own cells, not a brochure figure
Any published false-call rate, including figures from Royma’s own field experience, reflects a cell design, a stacking process and threshold settings that differ from yours. We therefore quote no rate here. Instead, we recommend a defined counter-check that gives a plant its own two numbers before it invests.
“A plant does not need to trust our figure,” says Gabor Szabo, Sales Director Europe at Royma Europe. “It needs its own false-reject and escape rates, measured once on its own cells with a method that resolves the electrode stack.”
Step one: re-check the ejected cells
Start with the cells that the current or recommended inline inspection ejects as failures. Count them over a defined production period, per shift or per batch. Then re-examine the ejected batch with a 3D reference measurement, for example on the plant’s own laboratory CT.
The counter-check shows how many ejected cells carry a real stacking failure and how many were rejected although they were good. The second group is the false-reject rate. Multiplied by the line’s volume and the value of a good cell, it gives the first cost figure of the business case.
Step two: look for what the line lets through
The second check runs the other way. Take a statistical sample of cells that passed the inline inspection, or use the results of the end-of-line control. In addition, collect every cell ejected in a later process step and check it for a stacking failure that the inline inspection should have caught.
These cells go into the same counter-check as the ejected batch. The result is the escape rate. Each escape carries the cost of formation and the later process steps, plus the cost of a failure found downstream.
From two rates to a plant-specific forecast
With both rates measured, the forecast needs only the plant’s own cost data:
- the false-reject rate, multiplied by cell volume and the value of a good cell
- the escape rate, multiplied by the cost of formation and later steps per faulty cell
- the cost and risk of a failure that is found only at the customer
- the space available for the inline station, since an inline CT needs a larger footprint than a 2D X-ray station
“Once a plant has both rates for its own line, the calculation is straightforward,” Szabo adds. “It shows what the current rejects and escapes cost, and what 100% inline 3D inspection would save.”
The same data has a second use. Because inline CT measures every electrode layer of every cell, it gives the stacking process a more precise feedback loop than a pass or fail signal. The defect classes that the counter-check reveals are the classes that the RMLCT7500 is set up to detect and report.
RMLCT7500 at a glance
| Parameter | RMLCT7500 (stated figures) |
|---|---|
| Machine type | Inline gantry CT, modular gantry system |
| Inspection | 3D CT, 100% inline, fully automatic |
| Throughput | up to 36 ppm, depending on configuration, cell thickness and inspection points |
| Cell format | prismatic cells |
| Configuration | customisable scanning area and customisable error-type detection |
| Defects addressed | anode and cathode overhang at the four corners; crinkled and folded electrode edges; electrode alignment; electrode-to-shell distance; electrode punctures, folds and cuts; foreign objects |
Start the forecast with your own cells
Royma Europe helps cell plants set up the counter-check: the sample plan for ejected and passed cells, the reference measurement and the cost model behind the forecast. We evaluate the results together with your quality and process engineers, and we discuss reference scans of your ejected cells case by case.
Contact Gabor Szabo, Sales Director Europe, Royma Europe, gabor_szabo@roymatek.eu, +49 15156503316, www.roymatek.eu.
Royma Europe, Leibniz Universität Hannover – Institut für Produktentwicklung und Gerätebau, Gebäude 8143, An d. Universität 1, 30823 Garbsen, Germany.